Table of Contents
When dealing with a large and complex web application, you might often run into situations where an operation is slower than it should. Let’s see how we can run a performance trace to find out what’s slowing things down.
What is a performance trace?
A performance trace is a record of the events that happen during the execution of a program. It is a log of the events that happen in the browser, and it can be used to find out what’s slowing down the execution of a program.
How to run a performance trace?
To run a performance trace, we need to open the Chrome DevTools and go to the Performance tab. Once there, we can click on the record button to start recording the performance trace. We can also throttle the CPU and network speeds to simulate running on low-end devices.
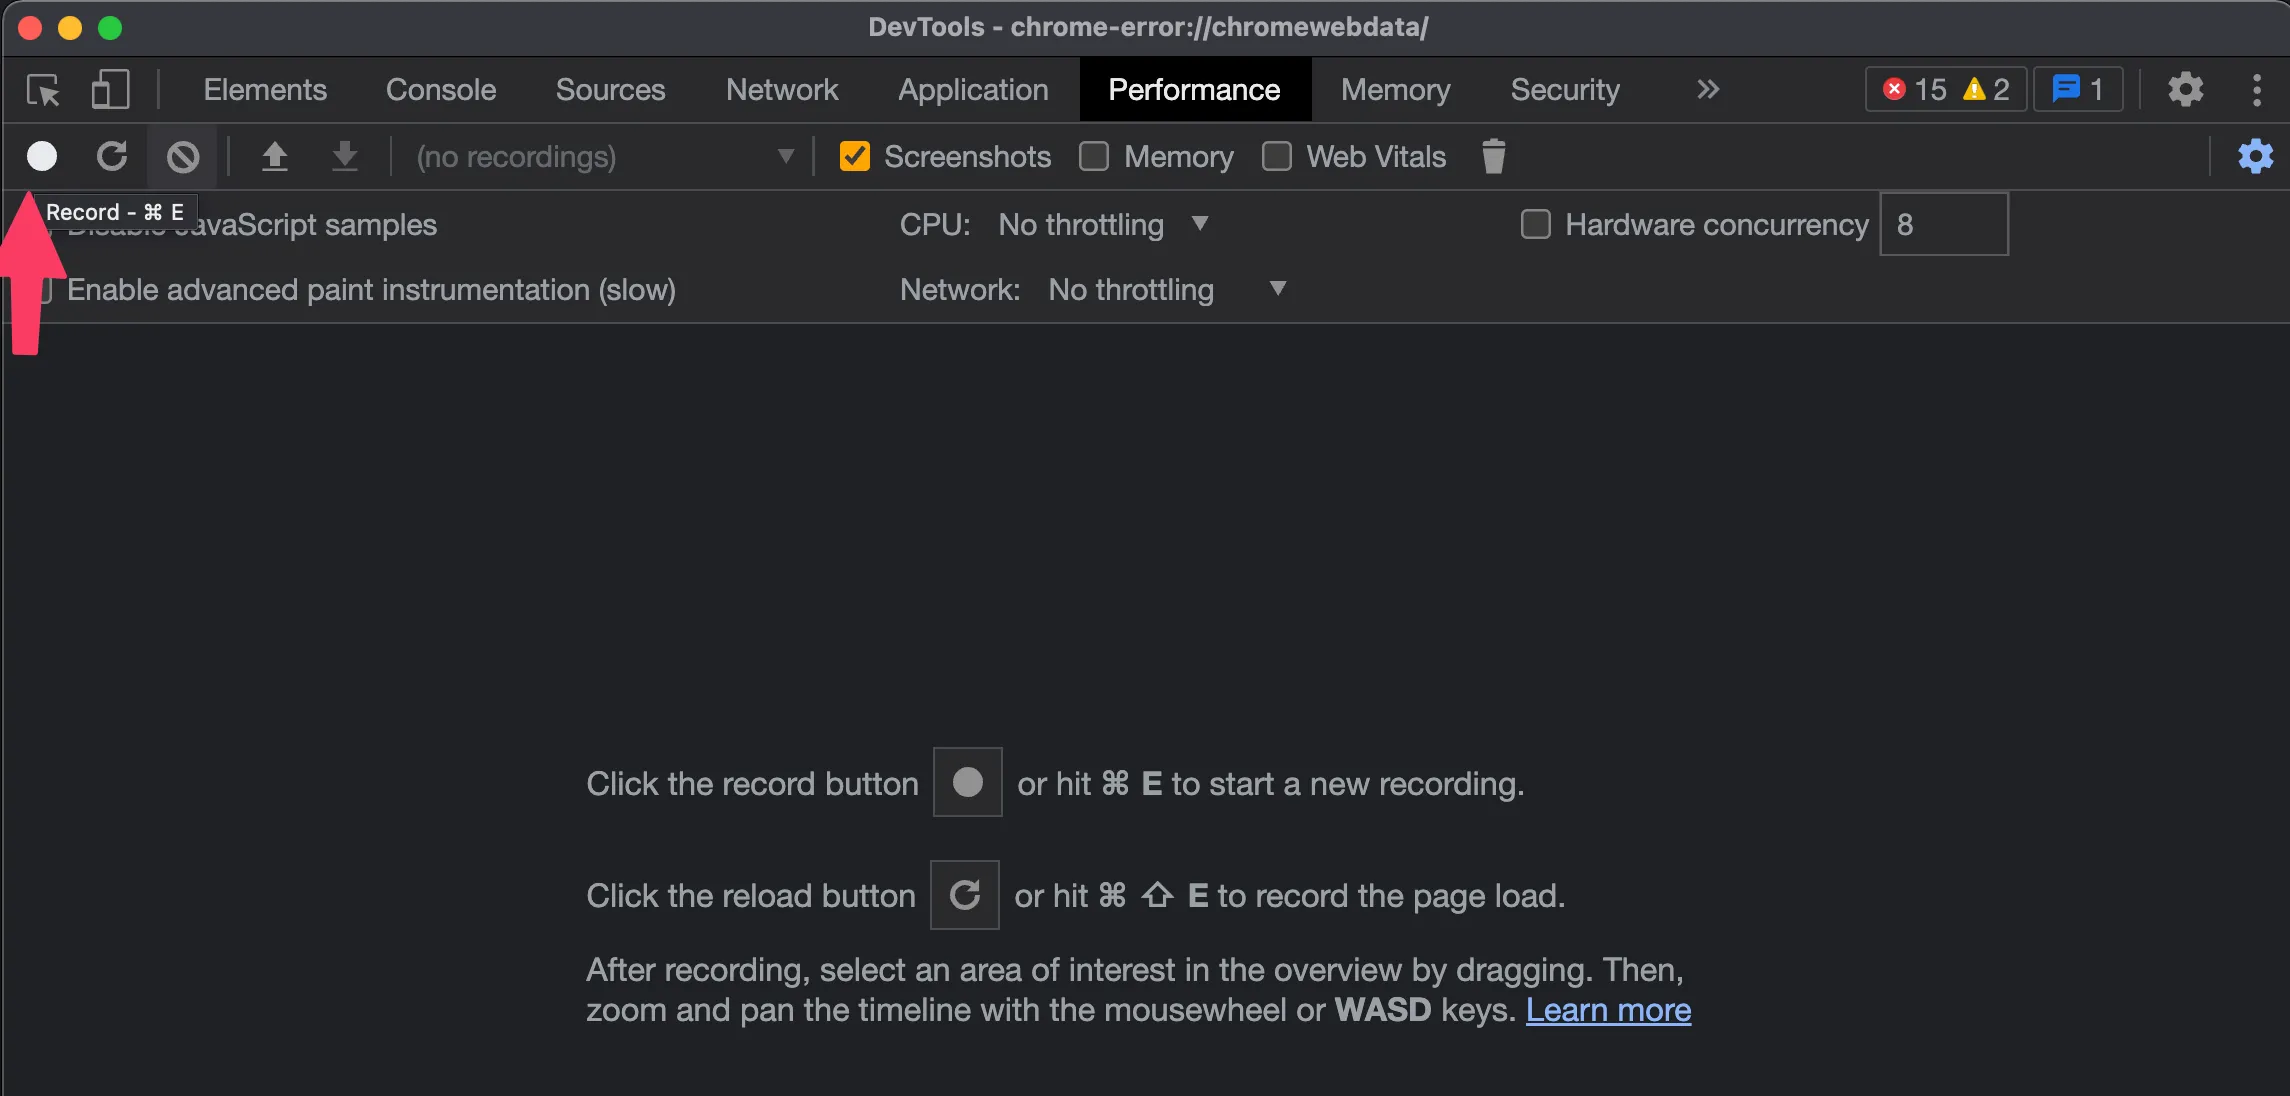
Once we click on the record button, the browser will start recording the performance trace. We can then perform the actions that we want to trace, and then click on the stop button to stop the recording. Once the recording is stopped, we can see the performance trace in the Performance tab. We can also save the trace to a file, then load it later, or share it to someone else.
Analyzing a performance trace
Let’s take an example of a performance trace I ran to figure out why an operation was taking so much time. The operation was simple - selecting an element on the canvas of InVideo’s editor. Upon running the performance trace, I found out that element selection was happening quickly, but the sending of analytics event was taking long. Here’s the perf trace -

As you can see, the sendEvent function is taking 100ms, and inside it, repeated calls are being made to isOneClickTemplate. There’s also a call being made to isEligibleForExperiment. These things are being recalculated everytime an analytics event is fired, which is unnecessary. They do not change everytime, so we calculate them once, and cache them, which is what I decided to do. (Do make sure you are invalidating that cache when the value is changing, which in my case was when the user changed project / template)
After making that change, I ran the perf trace again -
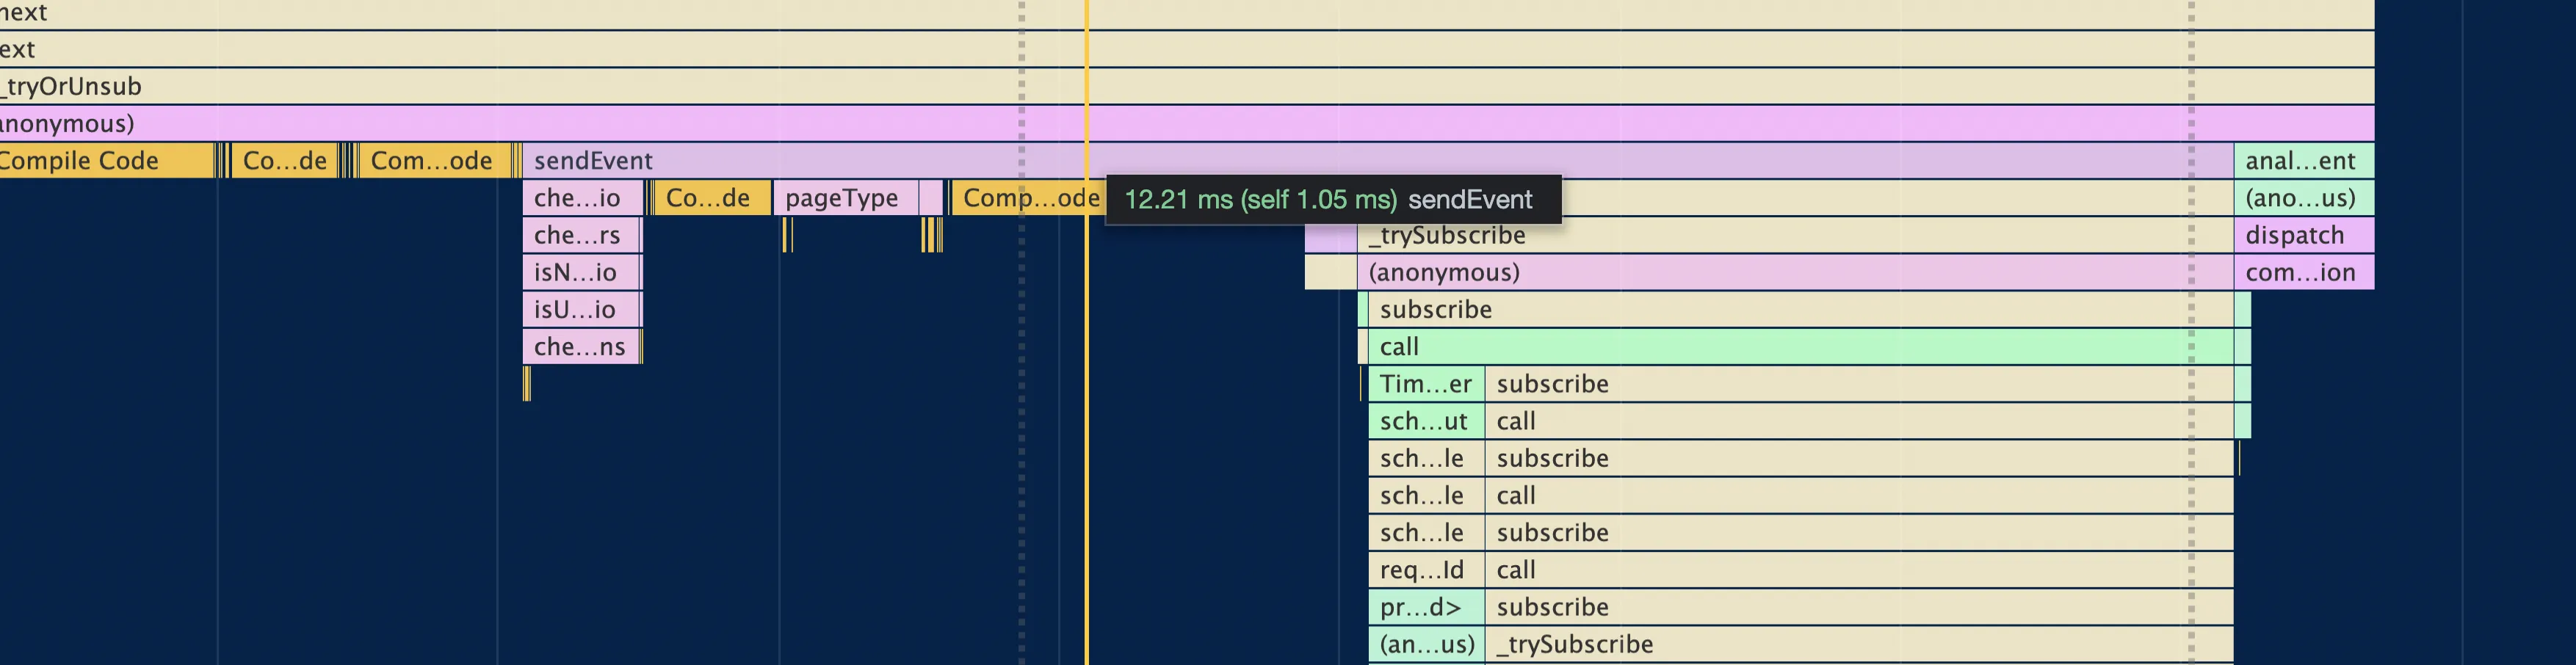
Voila! The time taken by sendEvent has reduced from 100ms to 12ms, which is a 10x improvement. It might not seem like a lot, but imagine that this function is called on every user interaction, it adds up! It’s a good practice to run a perf trace whenever you feel that something is taking too long.
This is just one example of how we can use performance traces to find out what’s slowing down our application. I’ve discovered all kinds of surprising issues via perf traces. In one instance, a getter function in an Angular component was doing heavy computation, slowing down the whole application! Doing the computation once and caching the result fixed the issue.
I would recommend you to take the Modern Dev Tools course by Umar Hansi to learn more about performance tracing and other dev tools. It’s a great course, and I’ve learned a lot from it.
Conclusion
In this article, we saw how to run a performance trace to find out what’s slowing down the execution of a program. We also saw how to analyze a performance trace to find out what’s slowing down the execution of a program. I hope this post helps you in your journey of building performant web applications. If you have any questions, feel free to reach out to me on Twitter .